
Chatham IL Housing Market Trends & What They Mean
November 27, 2025
November 27, 2025
Trying to make sense of the Chatham housing market? You are not alone. Whether you are buying your first home, moving up, or preparing to sell, you want clear, local insights you can trust. In this guide, you will learn how to read the key trends that shape prices, speed of sales, and competition in Chatham, plus practical steps you can take right now. Let’s dive in.
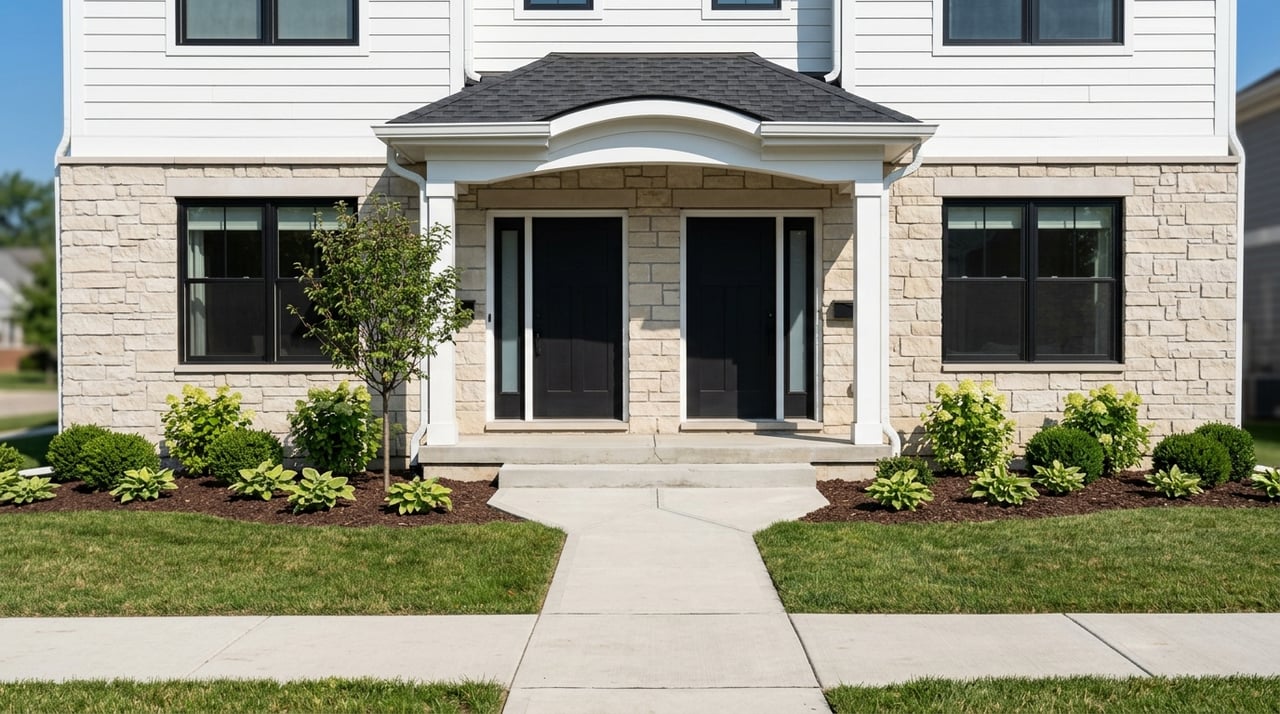
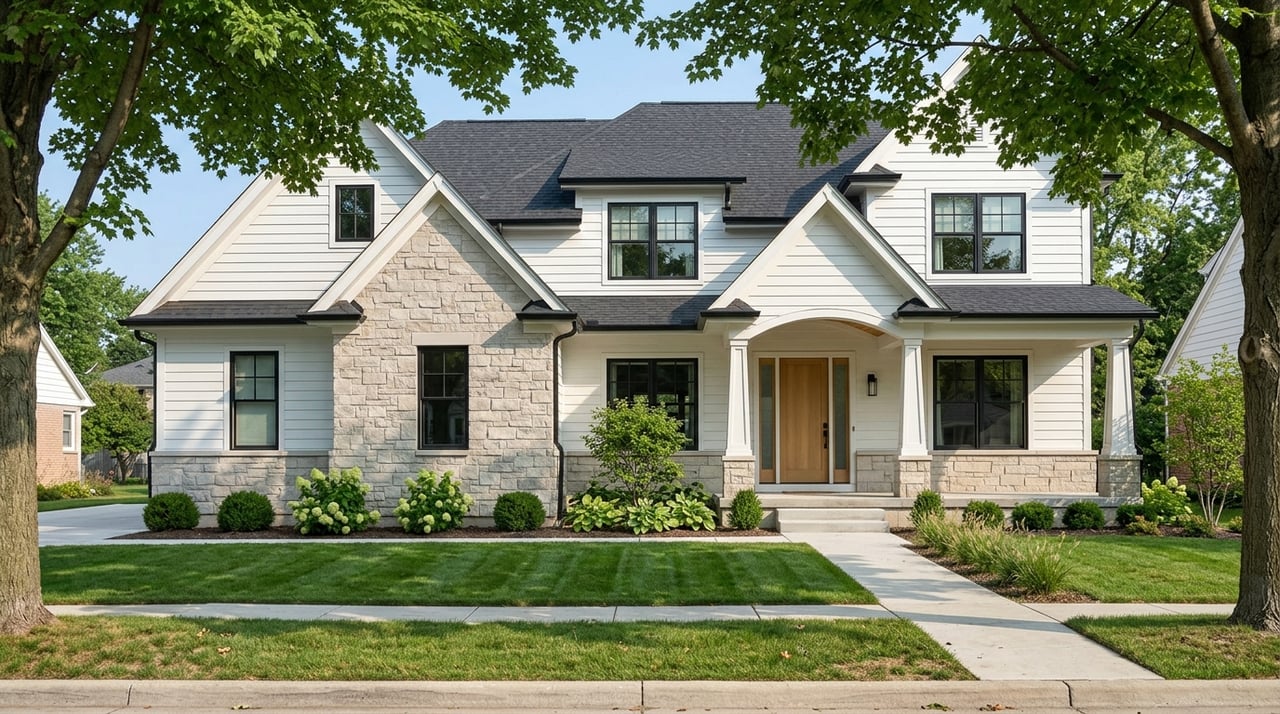
Chatham sits in Sangamon County within the Springfield metro, and it works largely as a commuter community. Single-family homes make up most of the housing stock, with some townhomes and limited multi-family options. You will find established subdivisions and periodic new construction.
Demand in Chatham is supported by several factors. Many buyers value Ball-Chatham CUSD 5 school boundaries, proximity to Springfield’s employers in state government, healthcare, and education, and a small-town lifestyle with parks and community amenities. Access along I-55 and IL-4 helps keep commutes straightforward for many households.
To understand pricing, focus on a few core indicators from the local MLS:
For context, compare Chatham with the Springfield metro and Sangamon County averages. If Chatham outperforms the wider area, it often reflects strong demand from commuters and school-boundary buyers. If it lags, buyers may find more room to negotiate.
Inventory tells you how much choice buyers have and how much leverage sellers hold. Watch these metrics:
Lower MSI and lean active inventory often mean a competitive environment. Rising new listings can ease pressure and support more balanced negotiations.
Velocity metrics show how quickly homes go under contract and close.
Shorter DOM and a higher over-asking share typically signal strong buyer demand. If pendings outpace new listings for several months, the market can tighten further.
Market balance blends supply and demand indicators. In general, low MSI, shorter DOM, and strong sale-to-list ratios point to a seller-leaning market. Higher MSI, longer DOM, and more frequent price reductions indicate a buyer-leaning market.
Competition can vary by price tier and neighborhood. Entry and mid-price homes may see quicker activity than the upper segments when mortgage rates shift. Always analyze by your specific price range and subdivision to get the true picture.
New builds play an important role in Chatham’s housing mix. Building permits for single-family homes help you spot where supply is coming. Active subdivisions and local builders can influence pricing in nearby resale neighborhoods. When new-home deliveries rise, buyers get more options and sellers may adjust pricing or offer concessions to compete.
If you are deciding between new and resale, compare total cost of ownership: lot size, finishes, warranties, energy efficiency, and potential wait times for completion.
Affordability depends on local incomes, home prices, and mortgage rates. Track:
Even small rate shifts can change buyer budgets and monthly payments. If you are buying, get pre-approved and update your numbers frequently. If you are selling, understand how current financing patterns affect your likely buyer pool.
Chatham’s housing demand is closely tied to regional employers. The Springfield area’s state government, healthcare systems, and education institutions form a steady economic base. Many Chatham residents commute to Springfield, with connectivity via I-55 and IL-4 supporting daily travel. Population and household formation trends from the U.S. Census Bureau can help you see how the buyer pool is evolving over time.
Property taxes, homeowners insurance, and any special requirements like flood insurance influence monthly costs. Review Sangamon County assessment and tax records for parcel-level details and confirm estimated taxes for your target address. Use FEMA flood maps to check whether a property sits in a flood zone that may require separate insurance. Insurance quotes vary by home features and location, so price out coverage early in your search or pre-list process.
Chatham’s subdivisions differ by lot size, build years, and home styles. School boundaries, where applicable, can shape buyer interest, so confirm current Ball-Chatham CUSD 5 maps before making decisions. Identify “hot” micro-markets by looking for shorter DOM and stronger sale-to-list ratios, and find “value” areas where prices per square foot run lower than nearby peer neighborhoods.
If you are focusing on a few subdivisions, compare recent sales, current competition, and pending activity. Micro-market data helps you avoid overpaying as a buyer and prevents leaving money on the table as a seller.
Smaller markets commonly see stronger listing and buyer activity in spring and summer, with a slower pace in late fall and winter. Use monthly MLS data to time your strategy. Sellers often benefit from peak visibility and fresh buyer demand in spring. Buyers may see more choices in peak months and more negotiating room during slower periods.
You deserve clear, MLS-backed guidance and hands-on support. Our team’s local experience across Springfield and Sangamon County means you get real-time market reads, thoughtful pricing strategy, staging coordination, and contractor referrals that keep your move on track. If you want a current market brief for your price range and neighborhood, we are ready to help.
Ready to get answers for your situation? Connect with Cindy Grady II, Inc. to Request a Free Consultation & Home Valuation.
Stay up to date on the latest real estate trends.


3701 Wabash Ave Springfield IL 62711