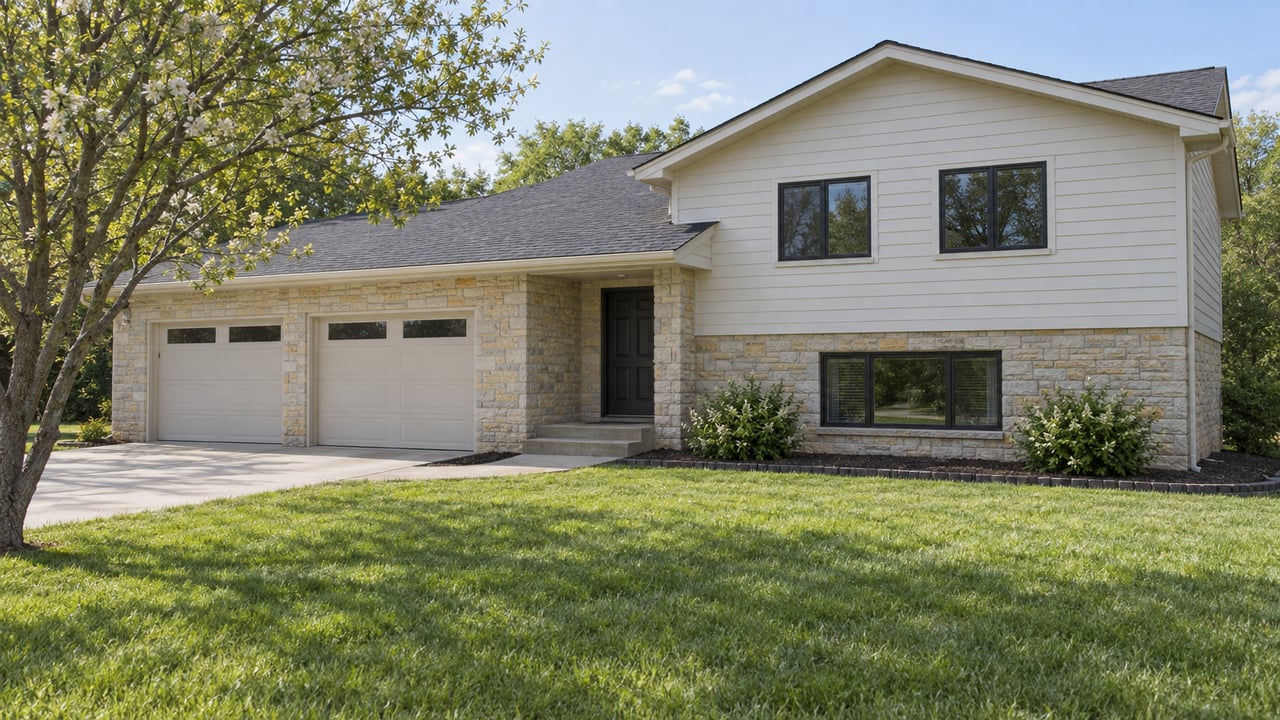
Why Don't Any Two Websites Agree On Rochester Home Prices?
October 1, 2026
October 1, 2026
Pull up Rochester, Illinois on four different real estate sites this week and you will get four different stories about the same village. One shows prices falling by double digits. Another shows them climbing. A third lists an average asking price nearly double what the fourth reports as a typical sale. None of them are lying. They are just measuring four different slices of a market that is behaving in two completely opposite ways at once, depending on which price tier you happen to be looking at.
That split, not a mistake in anyone's math, is the actual story in Rochester right now.
Here is what shows up if you check the major portals in the same week.
| Source | What it measures | Figure | Window |
|---|---|---|---|
| Redfin | Median sale price | $227,000 (down 18.2% year over year) | 3 months ending June 2026 |
| Redfin | Median price per square foot | $131 (up 3.6% year over year) | Same window |
| Redfin | Average days on market | 8 days (down from 38 the year before) | Same window |
| Homes.com | Median sale price | $277,500 (up 9% year over year) | Trailing 12 months |
| Zillow | Average home value estimate | $291,116 (up 8.0%) | As of late July 2026 |
| Movoto | Median listing (asking) price | $429,900 | Snapshot of active listings |
Read across that table and the contradiction is obvious. A median sale price falling 18 percent in the same window that per-square-foot value rose almost 4 percent should not be possible if it's describing one coherent market. It is possible, and even expected, if the market is actually two markets wearing one ZIP code.
Movoto's $429,900 figure is not a sale price. It's the median asking price of the handful of homes sitting on the market at the moment the page was pulled, roughly eleven listings. That distinction matters more in a village this size than it would in Springfield proper, because a small active pool skews toward whatever hasn't sold yet, and what hasn't sold yet in Rochester tends to be the acreage and higher-end properties.
Recent listings tell that story on their own. Alongside in-town ranches, the active inventory has included a 2.5-acre walkout property marketed for "peaceful country living," a 1.83-acre parcel with a pole barn and four-season room, and a roughly 43-acre tract southeast of the village with tillable ground and river frontage. These are the homes still waiting for a buyer, and because they sit longer, they pull any snapshot of "what's for sale right now" toward a higher number. Meanwhile, the homes that move fast disappear from that pool within days, so a listing-price snapshot almost never catches them.
Zillow's number is a computed value estimate across the whole housing stock, not a transaction figure at all, which is why it lands somewhere in the middle and moves more slowly than either sale-price series.
Redfin and Homes.com are both measuring closed sales, but over different windows, which is exactly where the 18 percent drop shows up. A 3-month window in a village that only closes a few dozen sales a year can be dominated by a single batch of similar homes. If June 2026 happened to be a month where several smaller, faster-moving properties closed rather than the usual mix, the median for that quarter drops even though nothing about underlying values changed. The 12-month Homes.com figure smooths that out and shows the gain that's actually been building underneath.
The subdivision names tell you where the speed is. Homes have recently moved through Meadows, Timberlane, and Woodlands, along with newer construction in Oak Mill Estates, where a builder was still finishing duplex units this year. These are the in-town, move-in-ready properties inside Rochester CUSD 3A, and they're the ones showing up with eight-day average market times and multiple recent closings in a single month.
The acreage and larger custom properties, several of them five bedrooms or more, sit outside that pattern entirely. They aren't overpriced or unwanted. They simply serve a smaller and more patient pool of buyers, and Illinois's own statewide data this year backs up why: a market with a sale-to-list ratio near 98 percent and around 55 days on market overall, as tracked in Illinois REALTORS' statewide figures, gives buyers real room to be selective once they're above the entry tier. That's a market with leverage on both sides, just not the same side depending on price point.
Put the two tiers next to each other and the contradiction in the portal data stops looking like noise. It's a picture of a village where the affordable, well-located homes clear almost as fast as they're listed, while the properties priced for a smaller buyer pool take the time they take. Any single statistic that averages the two together will bounce around depending on which type of home happened to close during the window it's measuring.
The practical version of all this is simple: the citywide median is not the number that applies to you. It's an average of two different buying experiences.
If you're shopping or pricing a home in the entry-to-mid range near the school district, expect the eight-day, multiple-offer version of Rochester. That means having financing ready before you tour, not after, and being prepared to write an offer within the first weekend a home is live.
If you're on the acreage or upper end of the market, expect the other version. Pricing accuracy matters more than urgency, because your buyer pool is smaller and more patient, and a home that's priced even a little ambitiously can sit for months while a fairly priced one two streets over closes in weeks.
Neither situation is better or worse. They're just different enough that a single headline number, whatever site it comes from, will mislead you if you don't already know which tier you're in.
Does an 18 percent median drop mean Rochester's market is cooling? Not on its own. The same window that produced that drop also produced a 3.6 percent gain in price per square foot and a jump from 38 days on market to 8. A cooling market doesn't usually sell homes faster. What the numbers describe is a shift in which homes happened to close, not a decline in what any given home is worth.
Why would Zillow, Redfin, and Homes.com show three different directions for the same town? Because they're not measuring the same thing. One is a computed value estimate across the whole housing stock, one is a rolling three-month sale median, and one is a trailing twelve-month sale median. In a village with only a few dozen closings a year, those three methods can genuinely point in three different directions in the same season without any of them being wrong.
If you're trying to figure out which version of Rochester's market actually applies to the home you're buying or selling, that's a conversation worth having before you trust a single portal number. Cindy Grady Bunch works this market closely enough to tell you which tier your address falls into and what that means for how you price or offer.
Stay up to date on the latest real estate trends.
3701 Wabash Ave Springfield IL 62711